
Code Visualization
So here you are – sitting alone in the darkness, surrounded by the walls with mysterious texts, – and using the code editor to shine a beam of light onto this wall to read a small part of it. - IDE vs Fire Torch / HN
Mapper vs Packer
There is a physical knowledge graph in your head that represents your beliefs about reality. By physical, I mean precisely that – those are actual physical connections in the real world, like on molecular level. That’s why it’s so much easier to learn things right from scratch, instead of relearning them. You can’t just remove already grown connections. You have to grow a new one, stronger than previous.
the biggest challenge is visualizing the big picture.
Auto-generated documents focus on the file/class/line level details, but they don’t tell you the overall architecture, how components work with each other, the lifetime of components. - HN
Tools for visualizing a codebase
- repo-visualizer - plots files as bubbles, indicating their extension names and sizes with colors and sizes, respectively. ( DirTreestat could be use to do the same)
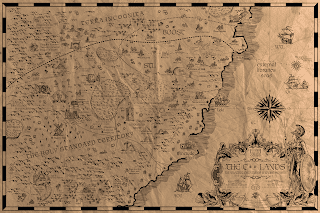
- see also Repography and Mountain for poster, as well as The C++17 Land
-
docker-compoze-viz - it’s also plotting extra information like open ports and mounted volumes.
- Visualize call graphs
- Code2flow supports a couple of dynamic languages, including Python, JavaScript, Ruby, and PHP.