Valgrind (profiler & memory check)
Valgrind is an instrumentation framework for building dynamic analysis tools. - Valgrind / git
Memcheck
How do I use valgrind to find memory leaks?
valgrind --tool=memcheck --leak-check=full --show-leak-kinds=all --track-origins=yes ./build/cg < test_21.txt
, --leak-check=full
see valgrind: –-tool=memcheck: command not found
Alternatives
Supported platform
- AMD64/Linux: up to and including AVX2. This is the primary development target and tends to be well supported.
- x86/Linux: up to and including SSSE3, but not higher – no SSE4, AVX, AVX2. This target is in maintenance mode now..
- and some others…
Additional tools
Notes: valgrind-3.13.0
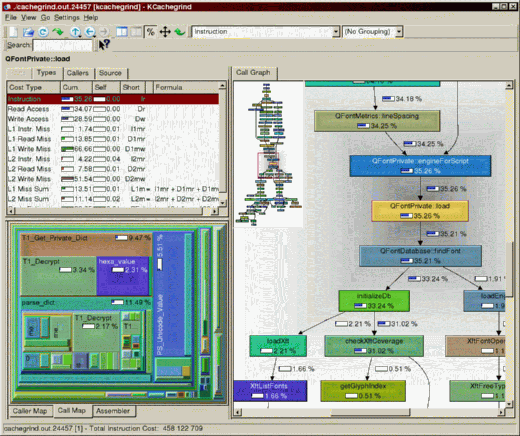
valgrind --tool=callgrind -v --dump-every-bb=10000000 ./a.out < data/game_1/01.dat UI
kcachegrind
Written on December 23, 2017, Last update on December 17, 2025
benchmarking
profiler
c++-memory
debug-c++